Monday, May 16, 2016

One Big Inflection Point We Will Look Back On

Article Source: http://www.thetechnicaltraders.com/partners/idevaffiliate.php?id=393&url=1584

This week will very likely be one we look back on as a big inflection point.  We will see that the bears are coming back.
It appears the market is forming a head and shoulders topping pattern. There are a couple different ways to trade this pattern depending on the level of skill and aggressiveness.
One can wait for a closing bar below the ‘neckline’ on the time-frame in which you have identified the pattern.  By operating on a closing bar basis you significantly reduce the risk of entering on a ‘false’ breakout. Entering prior to the close of the bar increases the risk of becoming part of the wick of a reversal candlestick should it close back above ‘neckline’ support.
Another way is to try and time the right shoulder and short into the bounce or pause just before you think a neckline break is about to occur.
Both, have then pro’s and con’s, which is better, that all depends on the overall market conditions and that of the trader making the trade.
Take a look a couple charts below so you can see where I feel the stock market is within this pattern.

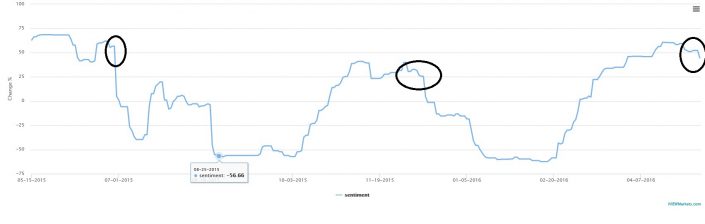
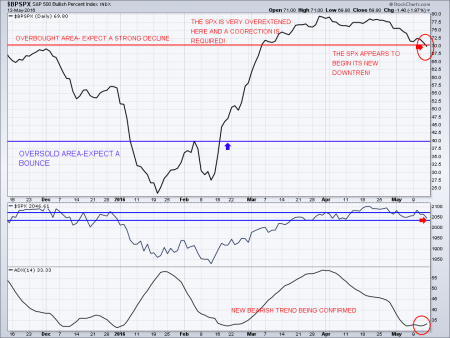
iViewMarkts.com Bullish Sentiment Indicator: This shows active traders have been very bullish and are just now starting to become bearish. As more short term traders start to sell their long positions and build up short positions this will put downward pressure on stocks and likely start the new trend down.
marketsentiment1
SP500 Bullish Percent Index:  This chart is telling us more stocks are starting to form bearish price patterns after being overbought the last couple months.
NEWBEARISHSPXCONFIRMED

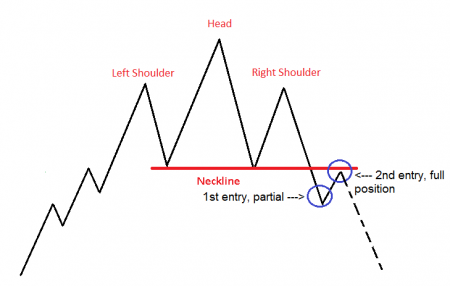
Head & Shoulders Pattern: This is the pattern I speak of showing where most traders enter positions for this price pattern. There is always a possibility that the market does not do a Kiss goodbye (retest of breakdown). The strongest moves to the downside will not retest the breakdown in most cases so playing the breakdown I think is vital.
H_S-dual-entry

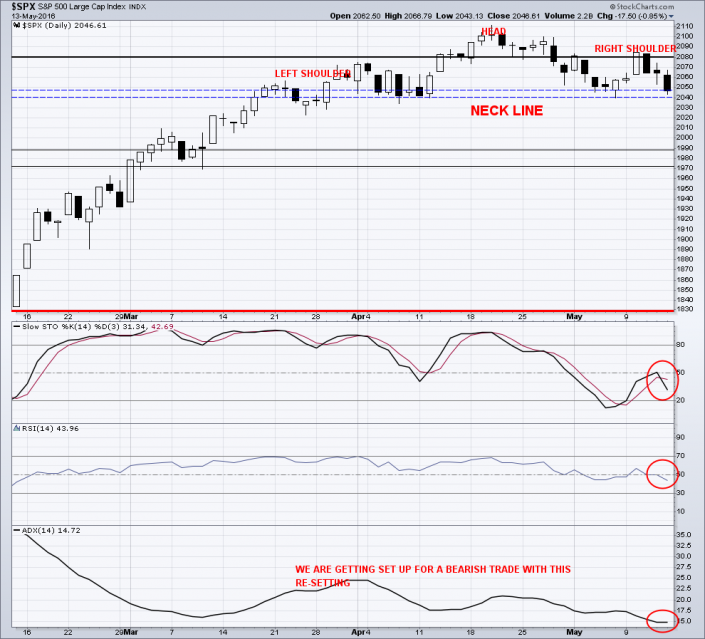
SP500 Head & Shoulders Pattern:
SPXHEADSHOULDERMAY15
That is a quick snapshot of the market and where it stands…
Get My Trade Alerts In Real-Time: www.TheGoldAndOilGuy.com
Chris Vermeulen

Copper Bites The Dust Behind Strong Oil

Article Source: http://www.ino.com/blog/2016/05/copper-bites-the-dust-behind-strong-oil/#.VzoSNY-cHIU/?a_aid=4901

All of the top commodities have rebounded amid the dollar's weakness recently, but copper didn't follow the pack to make gains. I think we should take a chance as this misbehavior will not last for long.

Chart 1. Copper-Oil Correlation: Huge Divergence!

Copper-Oil CorrelationChart courtesy of tradingview.com
The crude oil is very strong these days, although last time we have been witnessing its comparative weakness to copper. It looks like the Double Bottom reversal pattern is still making the game for oil with the first strong barrier at the $50 level.
This time, copper overreacted to the short-lived drop of crude hitting the $2.06 area, and this gap that we can see on the chart above kept at the following strong rebound. And then another weird thing happened – crude oil had a minor pullback and continued its upward move while copper overreacted again down to the previous low area at $2.06, this time with even larger divergence. Now look at the left part of the chart, the current gap reminds me the one-year-old situation – oil had stalled at the end of May 2015 while copper overcame it with a new high and then it dropped sharply to run down crude. Therefore, there is a high probability of copper catching up soon with the current oil price corresponding to $2.40-2.50 copper price levels.
Let's look at the copper chart below to find it out.

Chart 2. Copper Daily: Risk/Reward Favors Long Setup

Copper Daily: Risk/Reward Favors Long SetupChart courtesy of tradingview.com
In a previous copper update I assumed that the copper will fall out of the daily uptrend and will follow the weakening crude oil. Indeed, the metal dropped right the same day when the update was posted and soon reached quite a deep low at $2.06 level (18 cents gain), but failed to progress to the previous major low at $1.93 projected as a minimum target amid rising crude.
I would ask you to read my earlier post with a copper update to refresh your memory of how the current major bottom was shaped. It looks like the title of the post was prescient (Metal Signals Short Term Bottom For Oil) as well as the title of the next post which wondered if we had bottomed then.
If we admit that we already have bottomed, then the upside move from $1.93 level started this January is the first medium-term bullish action marked as the blue AB segment. Then the next zigzag down from the $2.32 area is the first medium-term pullback which has hit a very important and most common 61.8% Fibonacci retracement level below $2.08.
The Friday candle shaped the reversal Doji candle (open $2.076 close $2.074) with an almost absent body. Today’s candle is still in progress, but it already reached the high of the Friday candle.
If we assume that the CD segment started on Friday, and it is equal in length to the AB segment, then the target is located on the $2.4375 level – right at the area of the last October top. And it confirms the corresponding copper level of current oil price described below the Chart 1. So many coincidences bring more confidence that we should see a strong upside move in copper. The maximum risk should be set below the major low located at the $1.93 level, and the risk/reward then will be healthy.
Intelligent trades!
Aibek Burabayev
INO.com Contributor, Metals
Disclosure: This contributor has no positions in any stocks mentioned in this article. This article is the opinion of the contributor themselves. The above is a matter of opinion provided for general information purposes only and is not intended as investment advice. This contributor is not receiving compensation (other than from INO.com) for their opinion.

Goldcorp Is Back and Spending: Could West Red Lake Gold Mines Be Next?

Article Source: http://www.ino.com/blog/2016/05/goldcorp-is-back-and-spending-could-west-red-lake-gold-mines-be-next/#.VzoPp4-cHIU/?a_aid=4901

Goldcorp is fresh off an announced transaction of $520M for Kaminak Gold, which is a big win for the industry. The company has been quietly putting dollars in juniors, like $16M in Gold Standard Ventures, and there could be more to come. In this article, Resource Maven Gwen Preston discusses possible target West Red Lake Gold Mines and how this company is shaping up to take advantage of the initial turnaround in the market.

A million ounces of high-grade gold in Ontario, open for expansion. A management team that has done it before. A major miner as joint venture partner. A potential new discovery near the kind of structural intersection that can carry considerable gold in this part of the world. And cash in the bank to go back and drill test it. West Red Lake Gold Mines Inc. (RLG:CSNX/ West Red Lake Gold Mines Inc. (NASDAQ:HYLKF) has the right property, people, structure and plan to potentially hit a home run in a gold market looking for high grades in good jurisdictions.
RLG is headed up by Thomas Meredith. Merediths last company was VG Gold. He took the helm there when it was a broken company with a $3 million market capitalization. He cleaned up the management and board, and then focused on advancing and derisking the companys four projects, which were all historic mines in the Timmins gold camp in Ontario.
Under his leadership VG grew its resource base from 60,000 oz to 2 million oz, completed two PEAs, worked one project through a joint venture with Goldcorp Inc. (G:TSX/GG:NYSE), got permitting underway, and attracted Rob McEwen in as an investor, who took a 40% stake in VG through his company Lexam Exploration. About 18 months later Lexam and VG merged. By then, VG Gold had a market cap of $200 million.
Now Meredith is working to do it again.
RLG was a broken company when an active investor approached Meredith about coming in to fix it in 2012. Management was entrenched and not motivated; the geologists were academic, not practical.
It took two years but Meredith cleaned out management and most of the board. Then he started advancing RLGs asset: an Ontario property with historic mines in a joint venture with Goldcorp (sound familiar?).
The property, called West Red Lake, is pictured above. The light yellow portions belong 100% to RLG. The beige parts are in joint venture with Goldcorp.
As for location, West Red Lake is in Red Lake area, which near the western edge of Ontario. On the map the yellow dots are all mines, some in operation today and some historic.
Redlake3580
The three historic mines on RLGs property Mount Jamie, Rowan, and Red Summits it along the east-west trending Pipestone Bay-St. Paul deformation zone, a regional structure that continues eastward off the property.
Most of RLGs efforts to date have focused around the Rowan mine, where drilling and historic data support an inferred resource of 1.1 million oz, within 4.5 million tonnes grading 7.57 g/t gold.
The resource comprises seven steep, sub-parallel zones striking east-west that have been traced 1,200 meters along strike and from surface to 350 meters depth (on average). Gold generally occurs as visible millimeter-scale blebs in quartz veins, veinlets, and stockworks, especially near folded lithologic contacts.
Four of the zones (101A, 102B, 103C, and 104D) make up most of the resource. I will note that the veins are quite narrow. On its own, this resource is not likely enough to attract significant attention. But that's not the reason for interest now the resource could be the start of something bigger and is suggestive of the prospectivity of the land package.
In terms of something bigger: the easiest path forward from here is to drill the resource at depth, where it is wide open. Red Lake gold deposits often improve at depth better grades and widths so a few deep drill holes would be very interesting.
But the drill results RLG put out in March were not from the Rowan area. Instead, Meredith and his team decided to step out towards the other area of interest: 1 km to the east, where the east-west PBS deformation zone intersects the northeast-southwest trending Golden Arm structure (the more obvious dashed-line structure on the map).
/redlake4580
Intersections of this type are significant in the Red Lake camp. A similar intersection 20 km to the east essentially hosts two major, high-grade gold deposits Red Lake and Campbell plus a series of smaller deposits and occurrences.
The recent six-hole program stepped 500 meters east from the edge of the Rowan resource towards the intersection. The first five holes returned low-grade gold from intercepts in the deformation package, like 1.24 g/t gold over 1 meter and 1.44 g/t gold over 1 meter.
The sixth hole could be a discovery.
It drilled into alteration associated with the intersection, returning intercalated argillaceous graphites, feldspar porphyries, and cherty-banded iron formations, with silicification along lithologic contacts.
And at 297 meters depth the drill cut 1.5 meters grading 69.55 g/t gold.
The concept is that this hit could be the western edge of the alteration zone associated with the intersection. The Red Summit mine could be the eastern limit. That leaves 1,500 meters of prospective ground in between: 450 meters from hole 24 to the intersection, 300 meters of intersection, and 750 meters eastward to Red Summit.
RLG is a drill speculation, but one strengthened by a few key considerations.
1. Red Lake ranks among the top 10 most desirable gold jurisdictions in the world right now. There are operating mines 20 km away. A discovery could turn into an acquisition target for one of those operators.
2. RLG has a pretty tight share structure, with 88.6 million shares outstanding. Importantly, management owns about 17% and the investor who asked Meredith to take over at the helm owns 35%. Investors who did well on VG Gold and then followed Meredith into RLG own another chunk. In other words, 45% or less of the share count actually trades.
3. Meredith wants a VG repeat and is working carefully to make that possible. He is very careful with spending. He just raised money for the next drill program and was careful to involve dedicated investors. With VG he was able to attract a few financial sponsors, as he calls them major brokers whose active involvement make share prices move and he will look to do that with RLG when the time is right. Geology and discoveries are important, but good investor and capital management are equally vital.
RLG is about to head back for more drilling. Specifically, they will continue stepping holes eastward from the high-grade hit towards the structural intersection. Notable in that is the decision not to go for the easy ounces: they could spend half the budget drilling below the Rowan mine resource, where high-grade hits are almost guaranteed, but they are doing no such thing.
Instead all the drilling will test the idea that the structural intersection offers gold. Each hole will step closer to it. How this story plays out will depend what those steps look like, but for now I am happy to participate in this high-grade Red Lake gold exploration speculation.
With almost a decade of junior resource-focused journalism under her belt, Gwen Preston launched Resource Maven. Preston watches the wires, talks to her network and analyzes economics to identify resource news that matters and figure out how to profit. She focuses on early-stage exploration and development stories. Preston has been interviewed on CBC and in Financial Post.
Want to read more Gold Report interviews like this? Sign up for our free e-newsletter, and you'll learn when new articles have been published. To see recent interviews with industry analysts and commentators, visit our Streetwise Interviews page.
Disclosure:
1) Gwen Preston: I or my family own shares of the following companies mentioned in this interview: West Red Lake Gold Mines Inc. I personally am or my family is paid by the following companies mentioned in this interview: None. My company has a financial relationship with the following companies mentioned in this interview: None. I determined which companies would be included in this article based on my research and understanding of the sector. Statement and opinions expressed are the opinions of Gwen Preston and not of Streetwise Reports or its officers. Gwen Preston is wholly responsible for the validity of the statements. Gwen Preston was not paid by Streetwise Reports for this article. Streetwise Reports was not paid by the author to publish or syndicate this article.
2) Interviews are edited for clarity. Streetwise Reports does not make editorial comments or change experts' statements without their consent.
3) The interview does not constitute investment advice. Each reader is encouraged to consult with his or her individual financial professional and any action a reader takes as a result of information presented here is his or her own responsibility. By opening this page, each reader accepts and agrees to Streetwise Reports' terms of use and full legal disclaimer.
4) From time to time, Streetwise Reports LLC and its directors, officers, employees or members of their families, as well as persons interviewed for articles and interviews on the site, may have a long or short position in securities mentioned. Directors, officers, employees or members of their families are prohibited from making purchases and/or sales of those securities in the open market or otherwise during the up-to-four-week interval from the time of the interview until after it publishes.
Source for images and maps: Gwen Preston